Plotting extensions
This pages lists the plotting extensions included in the version of uLisp for the Lisp Badge.
Summary
Plotting functions
plot, plot3d
After generating a plot both functions wait for the ESC key to be pressed before displaying the uLisp prompt.
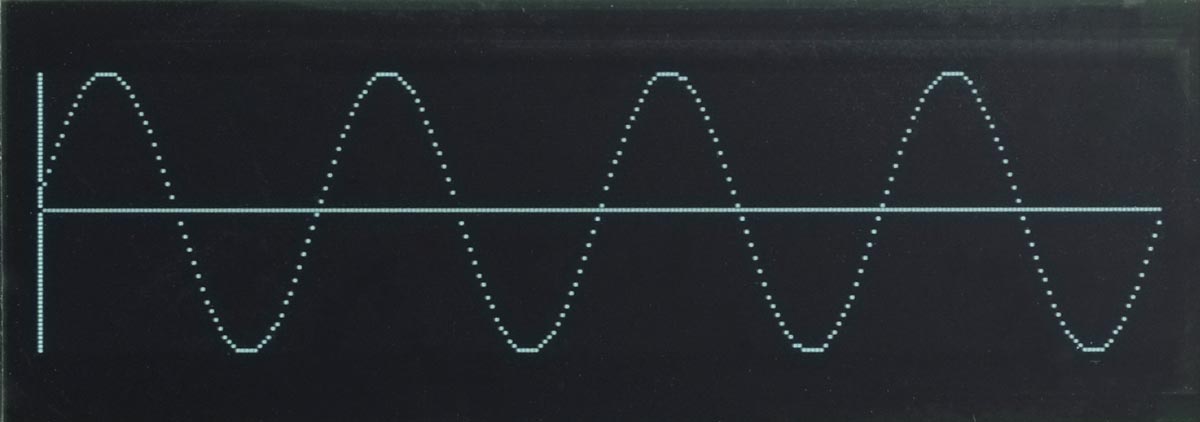
plot function
Syntax: (plot [x-intercept y-intercept] [function]...)
Plots up to four functions on the same graph, optionally with axes.
Each function should be a function of one parameter, the x coordinate, and it will be called with each value of x from 0 to 255. The function should return the y value, from 0 to 63.
If x-intercept and y-intercept are specified, plot3d draws axes through those intercepts.
For example, defining:
(defun sine ()
  (let ((x 0) (y 2045))
    (lambda (n)
      n
      (incf x (/ (* y 16) 163))
      (decf y (/ (* x 16) 163))
    (+ 32 (ash x -6)))))
the following command:
(plot 0 32 (sine))
will plot:
Plotting multiple functions
The following example plots the voltages on the analogue inputs 0 to 3 once a second on a single plot. First define:
(defun adc (n) (lambda (x) (delay 250) (/ (analogread n) 8)))
Then give the command:
(plot 0 0 (adc 0) (adc 1) (adc 2) (adc 3))
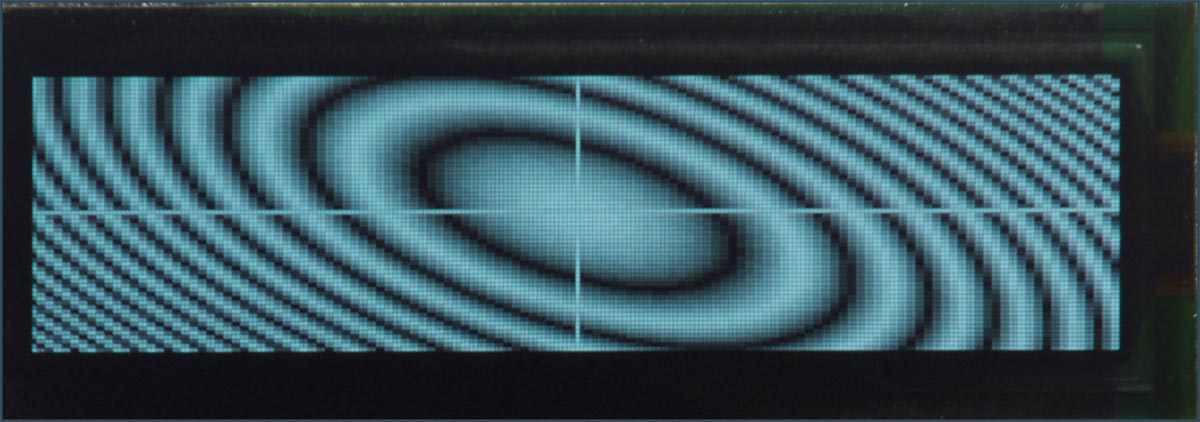
plot3d function
Syntax: (plot3d [x-intercept y-intercept] [function])
The function should be a function of two parameters, the x and y coordinates, and it will be called with each value of x from 0 to 255 and y from 0 to 63. The function should return the greyscale value to be plotted, from 0 to 15.
If x-intercept and y-intercept are specified, plot3d draws axes through those intercepts.
For example, defining:
(defun p (x y)
  (let ((a (/ (- x 128) 2))
        (b (- y 32)))
    (min (abs (- (logand (/ (+ (* a a) (* b b) (* a b)) 16) 31) 15)) 15)))
the following command:
(plot3d 128 32 p)
will plot: