Simple data plotter
Here’s a simple plotting function, written in uLisp, that will allow you to plot data, with axes, to an Adafruit 128x64 monochrome OLED display, or any other compatible I2C display (based on an SSD1306 driver chip).
It's ideal for plotting the readings from a sensor, such as the temperature over a 24 hour period, and is compact enough to run the demo in uLisp on an Arduino Uno.
Update
21st January 2025: Changed the program so it will also work on versions of uLisp with floating-point arithmetic.
7th March 2022: Updated the description to refer to the newer versions of these displays from Adafruit.
Introduction
A restriction of these routines is that they can only plot one value or pixel in each column, which avoids the need for a RAM buffer for the display. For many applications, such as plotting the value from a sensor against time, this is exactly what you want, so this minimal routine is ideal.
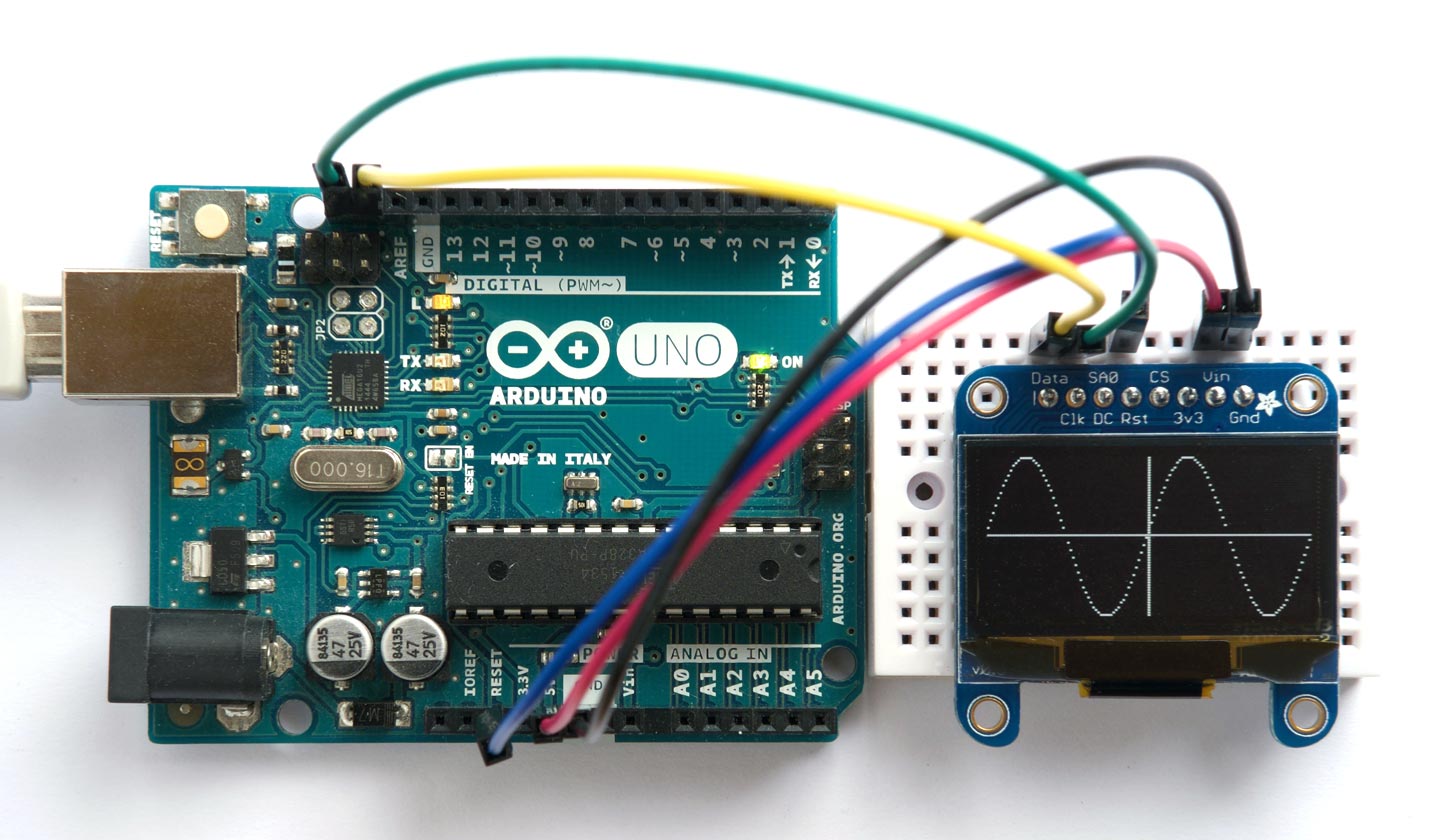
The display I used is the Adafruit 1.3" 128x64 OLED display, based on an SSD1306 driver. To use the original version of this display with I2C you needed to make two links with solder blobs on the back of the board. The latest version of this display defaults to I2C and includes two STEMMA QT connectors [1]. There's also a smaller 0.96" version [2]. The default I2C address on both versions is #x3D or 61.
Connect the SDA and SCL pins to Data and Clk respectively on the display, or use the STEMMA QT connector. On the older version of the display you should also connect the RESET pin to Rst on the display.
Initialising the display
The function (int) should be called first to initialise the display. The routines use the routine wbs to write multiple bytes to the display via I2C:
(defun int ()
  (with-i2c (s 61)
    (wbs s 0 #x8D #x14 #x20 #x01 #xA1 #xAF)))

(defun wbs (s &rest b)
  (dolist (i b) (write-byte i s)))
After calling (int) you should see a pattern of random dots on the display.
Plotting a point
You specify the position of the axes by the variables xa and ya; for example:
(defvar xa 64)
(defvar ya 32)
For no axes set xa and ya to -1.
The plot routine plt plots a point on the display at (x, y) where (0, 0) is the lower left corner of the display, x can be from 0 to 127, and y can be from 0 to 63. It uses the function set:
(defun set (yy byt)
  (if (<= 0 yy 7) (logior byt (ash 1 yy)) byt))

(defun plt (x y)
  (with-i2c (s 61)
    (wbs s 0 #x21 x x #x22 0 7)
    (restart-i2c s)
    (write-byte #x40 s)
    (dotimes (p 8)
      (write-byte
       (if (= x xa) #xff
         (set (- ya (* p 8)) (set (- y (* p 8)) 0))) s))))
Demo program
Here's the test routine, tst, that draws the sine wave in the photograph:
(defun tst ()
  (let ((x 0) (y 2045))
    (dotimes (i 128)
      (incf x (truncate (* y 16) 163))
      (decf y (truncate (* x 16) 163))
      (plt i (+ 32 (ash x -6))))))
To run the demo do:
(int)
(tst)
Clearing the display
This additional routine clr can be used to clear the display:
(defun clr () (dotimes (x 128) (plt x -1)))
Here's the whole program in a single file: Simple data plotter program.
For a full graphics library for an SH1106 128x64 OLED Display see Graphics display interface in Lisp.
- ^ Monochrome 1.3" 128x64 OLED graphic display on Adafruit.
- ^ Monochrome 0.96" 128x64 OLED graphic display on Adafruit.